
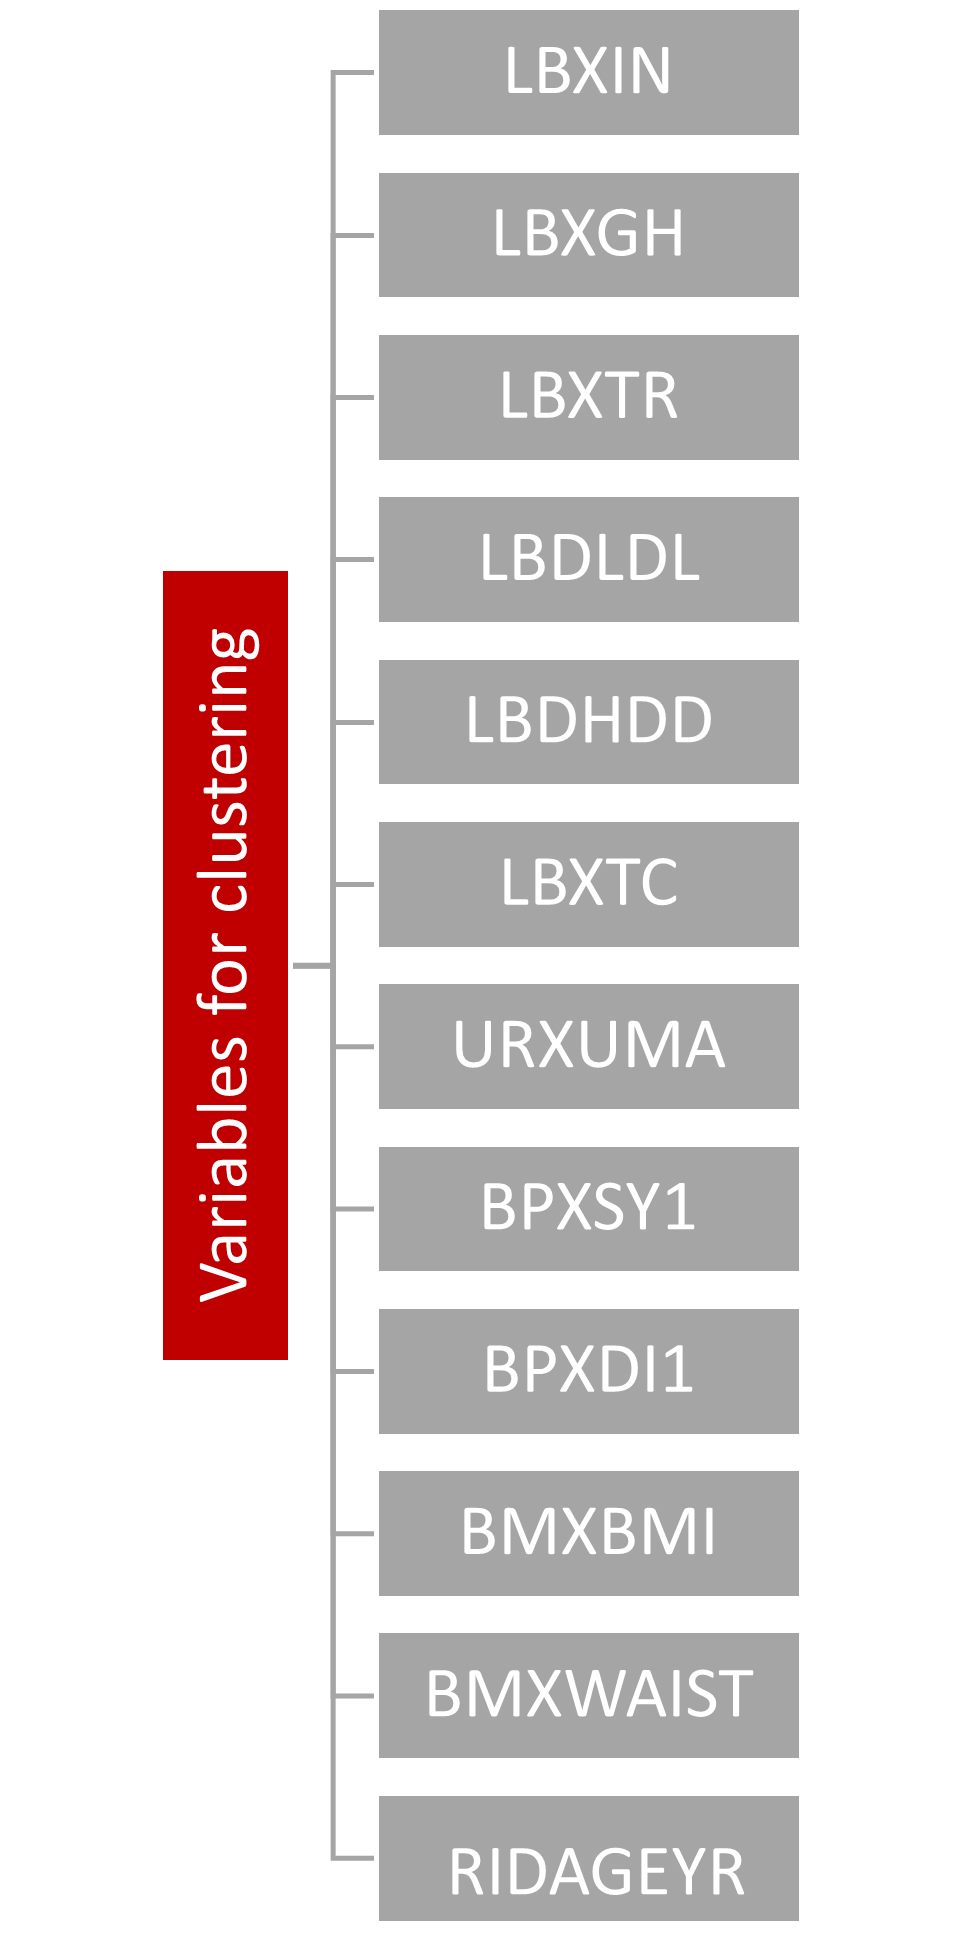
| RXDDRUG | RXDDAYS | LBXIN | LBXGH | LBDLDL | LBXTR | LBDHDD | LBXTC | URXUMA | BPXSY1 | BPXDI1 | BMXBMI | BMXWAIST | RIDAGEYR | RIAGENDR |
|---|---|---|---|---|---|---|---|---|---|---|---|---|---|---|
| INSULIN ASPART | 365 | 5.83 | 8.9 | 56 | 51 | 60 | 126 | 11.9 | 140 | 90 | 28.9 | 109.2 | 72 | Male |
| GLIPIZIDE | 4745 | 5.91 | 6.0 | 71 | 108 | 47 | 140 | 29.2 | 138 | 56 | 24.8 | 98.0 | 63 | Female |
{BayesCVI}
A Bayesian cluster validity index with medical applications
Objective
Learn prescribed drugs patterns through clustering
Why it matters
Public health issue
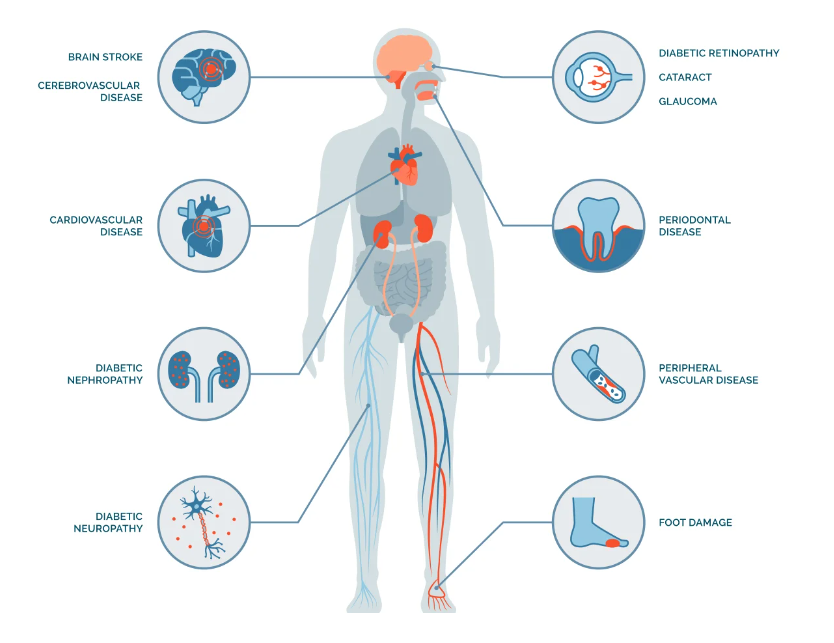
Diabetes is a chronic, metabolic disease characterized by elevated levels of blood glucose (or blood sugar), which leads over time to serious damage to the heart, blood vessels, eyes, kidneys and nerves.
Diabetes
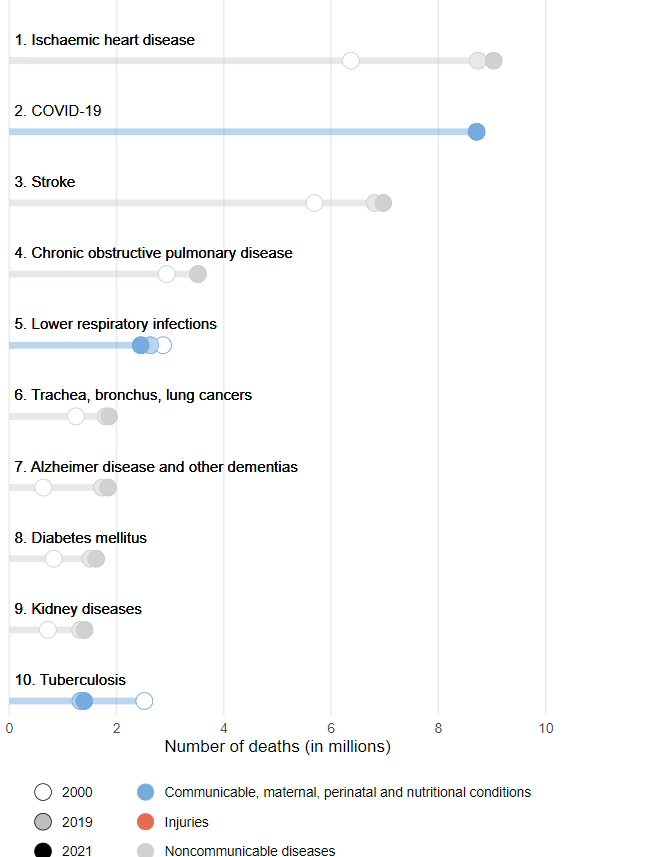
Diabetes is a global health crisis that has seen a dramatic rise in recent years. According to World Health Organization in 2021, it ranked among the top 10 causes of death worldwide, with a staggering 95% increase since 2000.
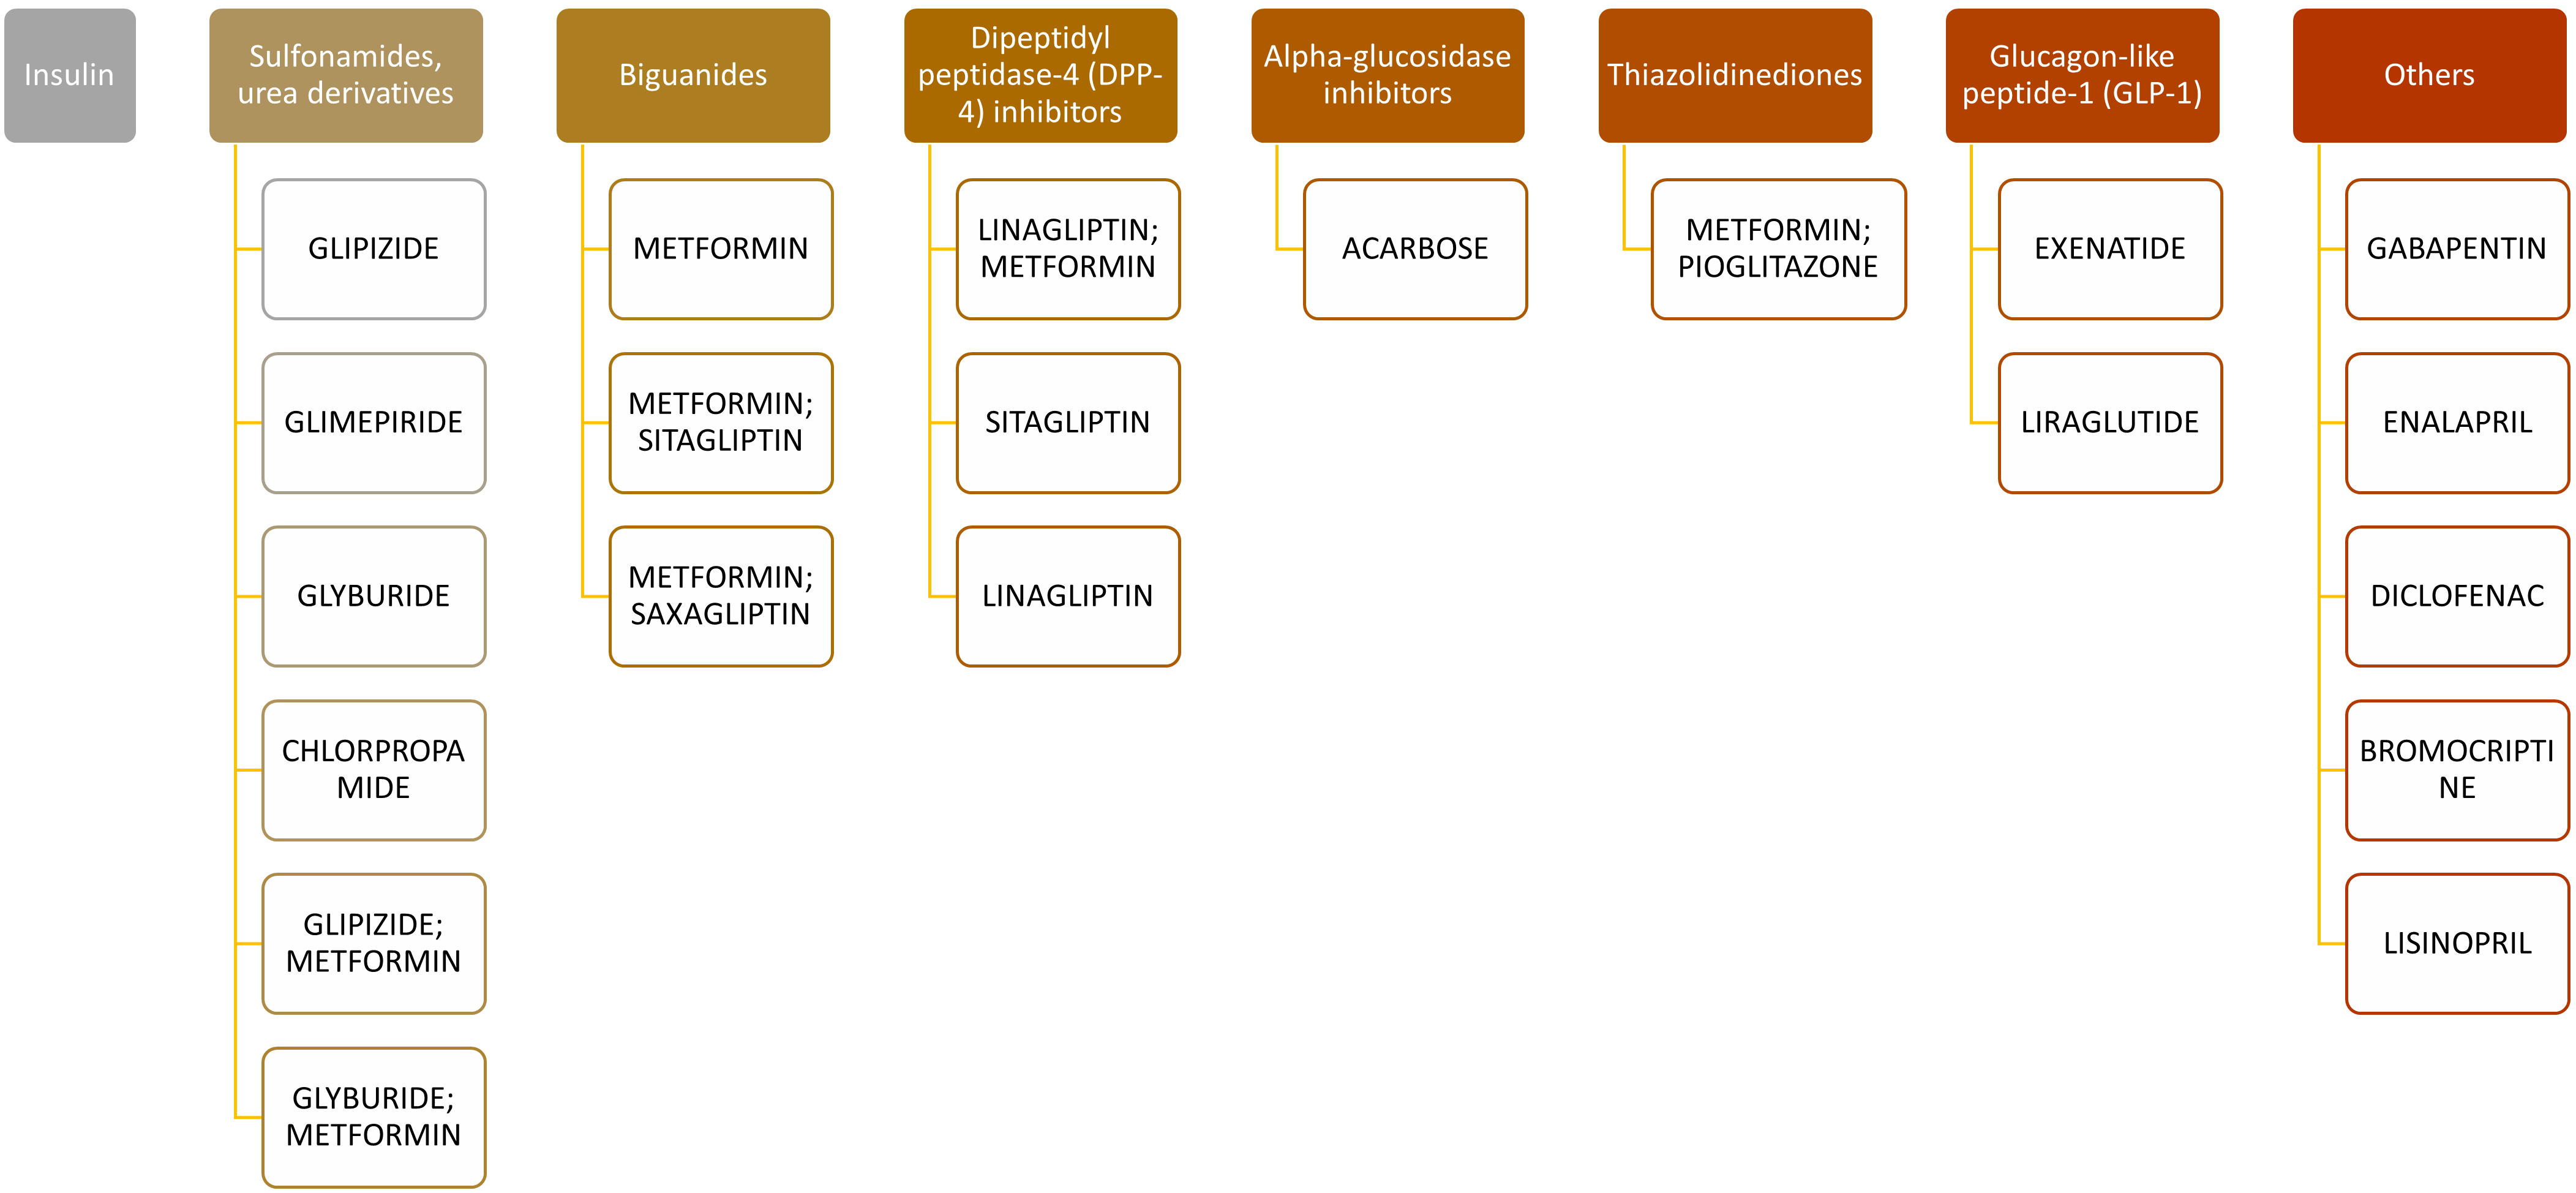
Classes of diabetic drugs in this data
Background
Cluster analysis (CA) is an unsupervised learning tool in machine learning that is widely used in various areas.

The aim is to identify natural groupings within a dataset that are not initially apparent and without prior knowledge of the groups.
Ref: Figure
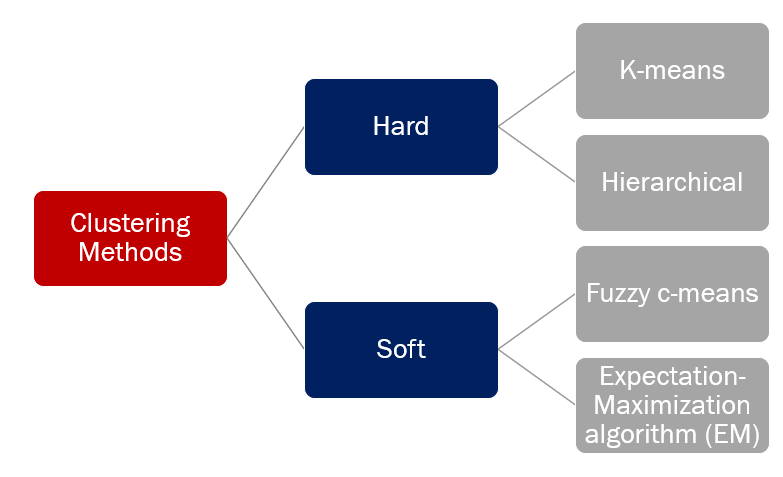
Clustering algorithms
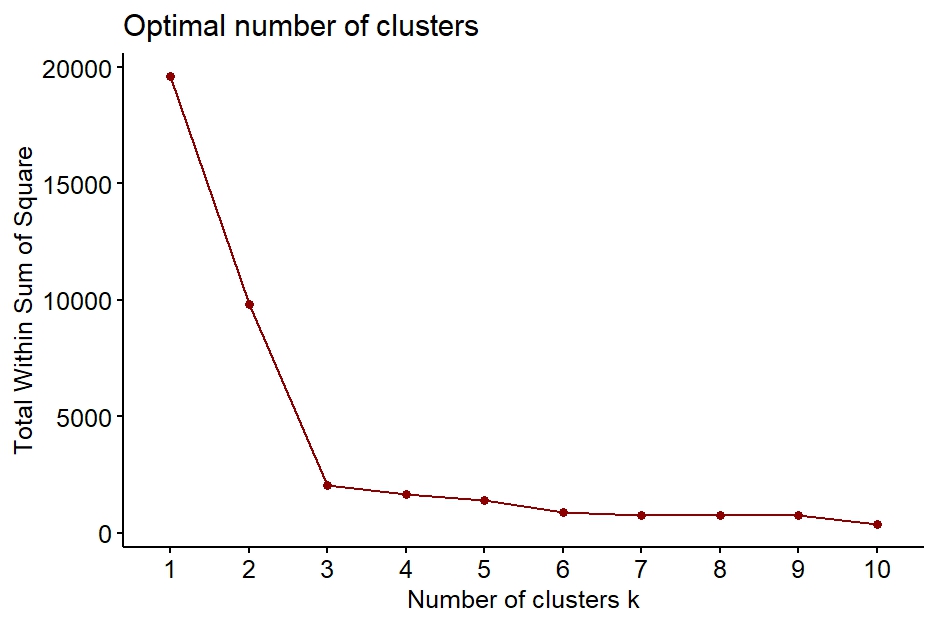
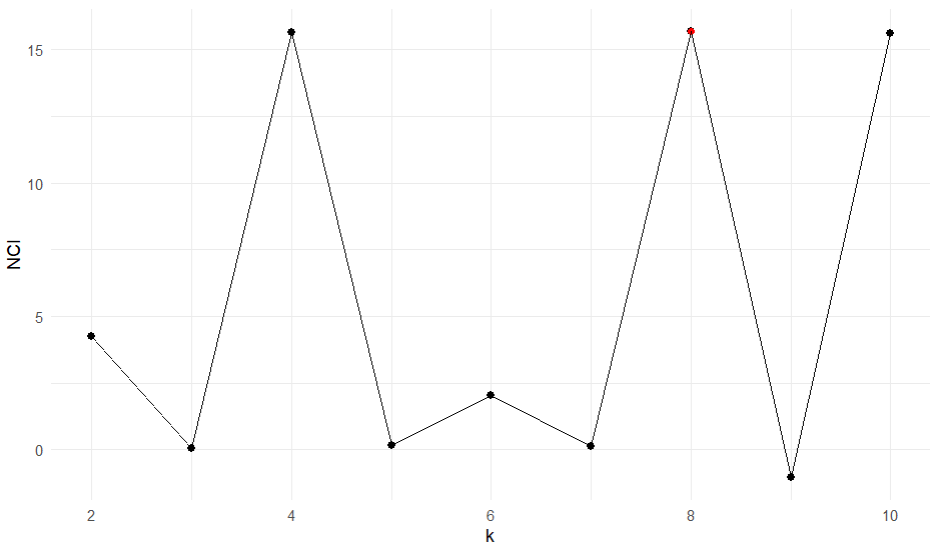
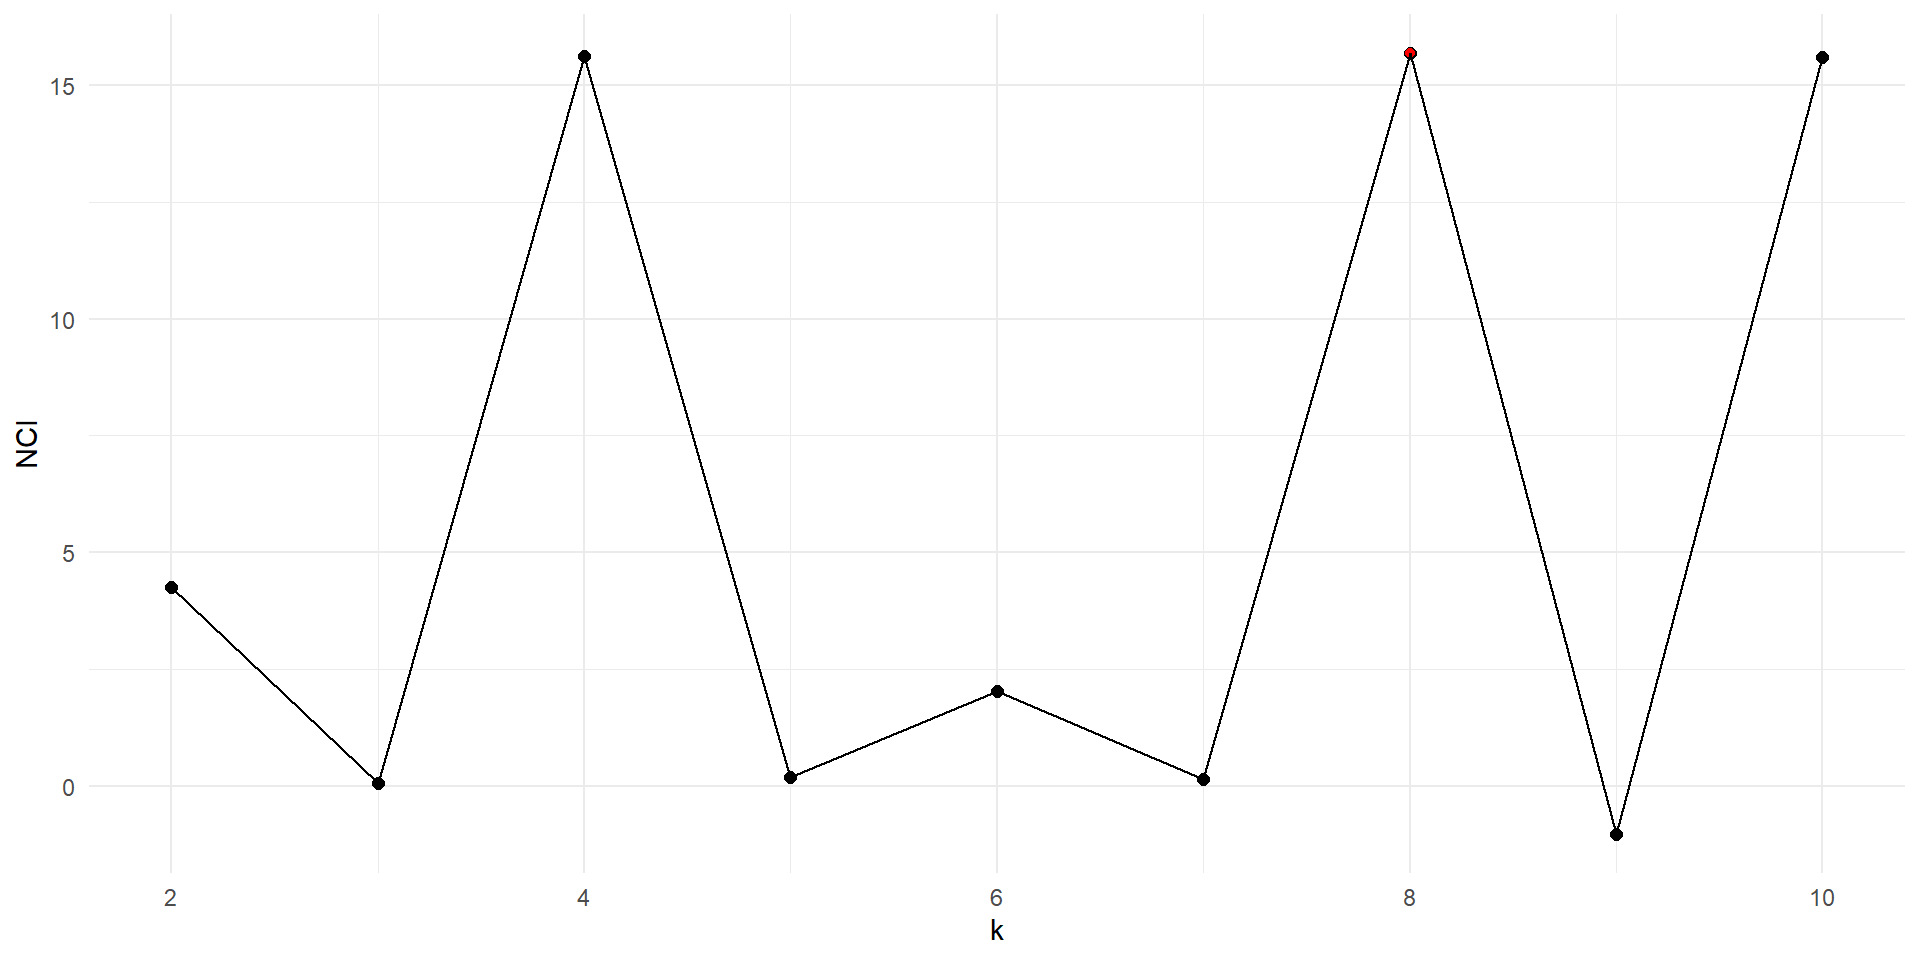
Determining the number of clusters
Elbow method
Applying CVI
Motivation
What if the optimal number is not what we are looking for?
Brain MRI: tumor detection
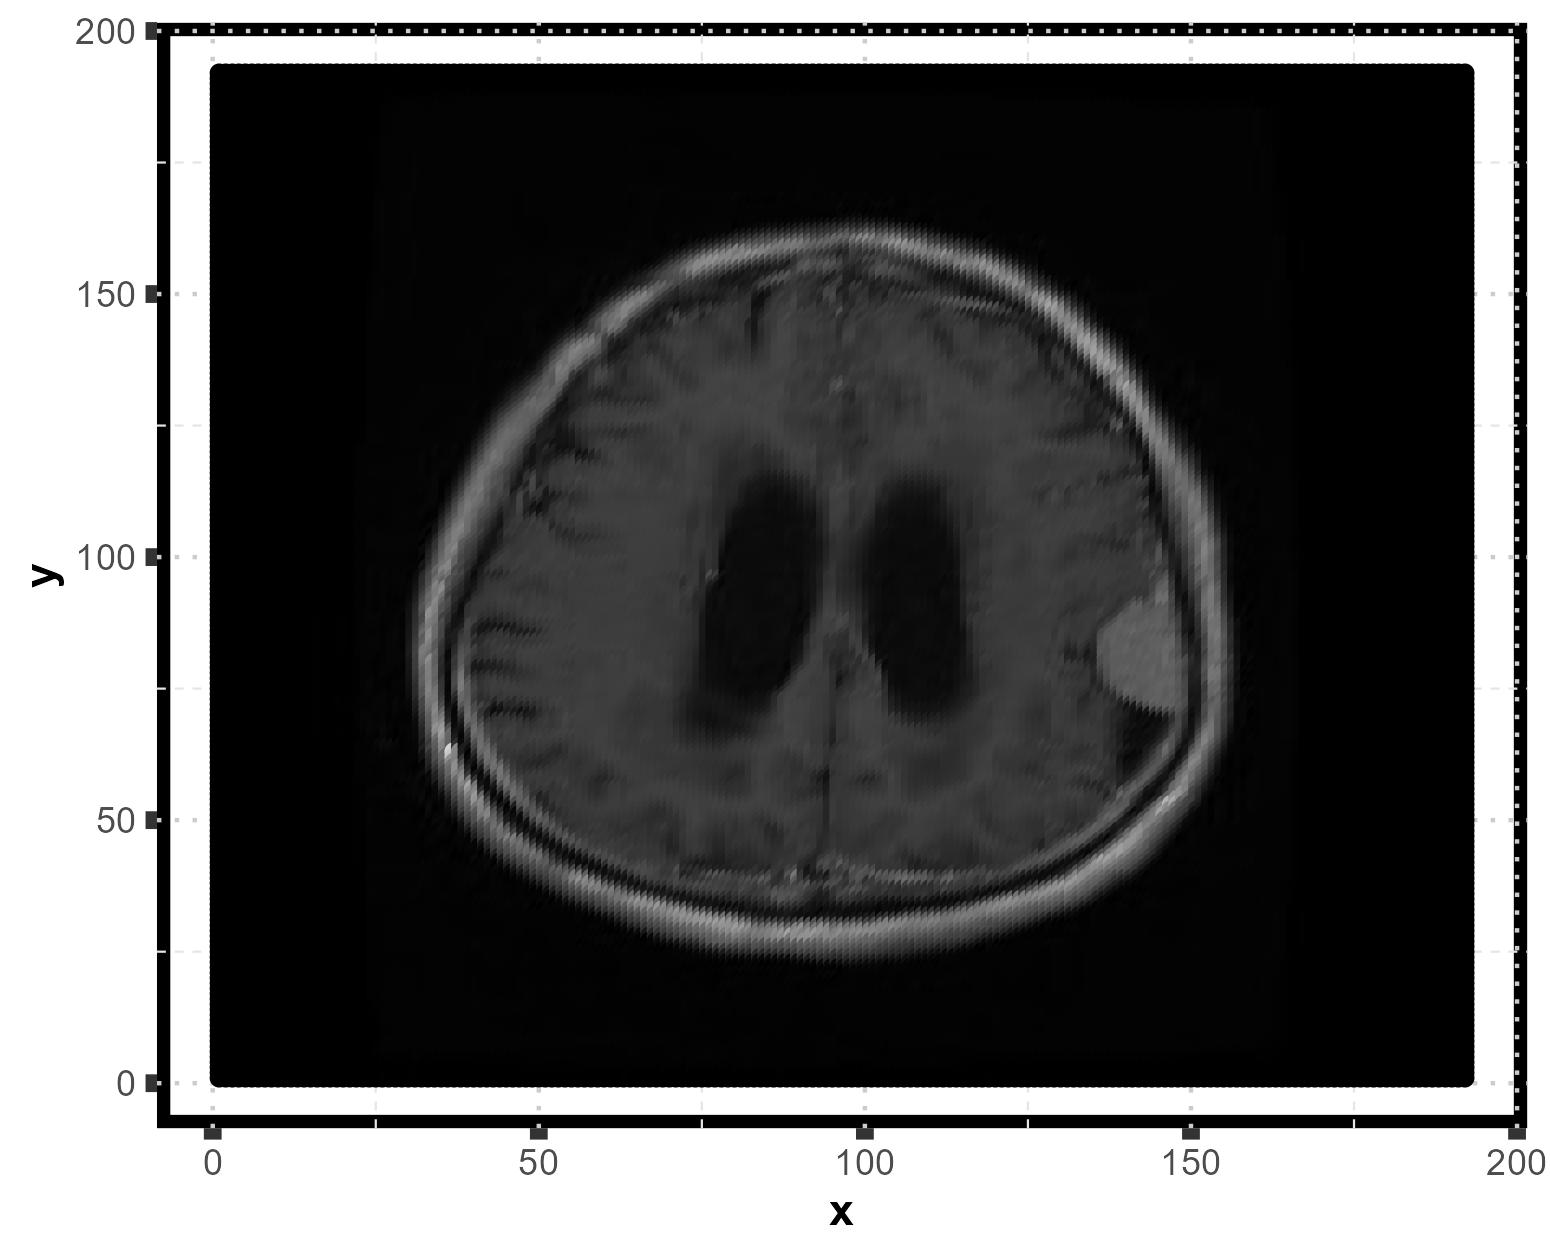
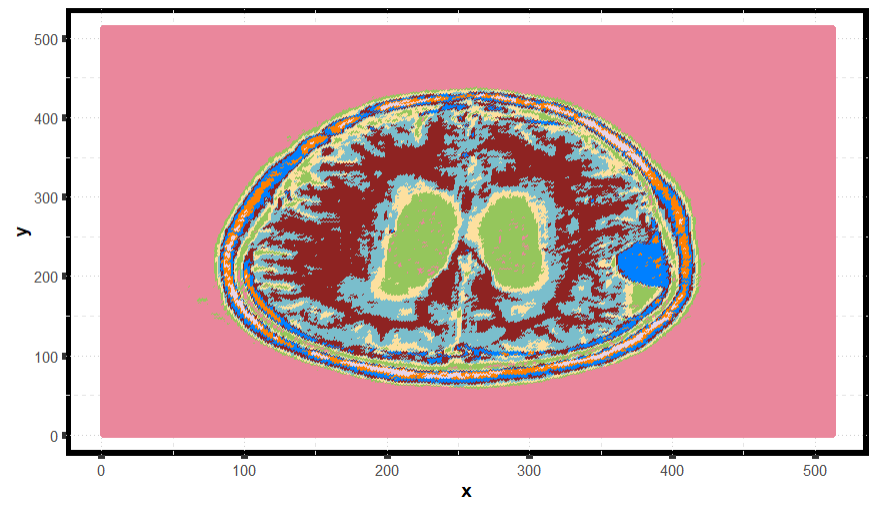
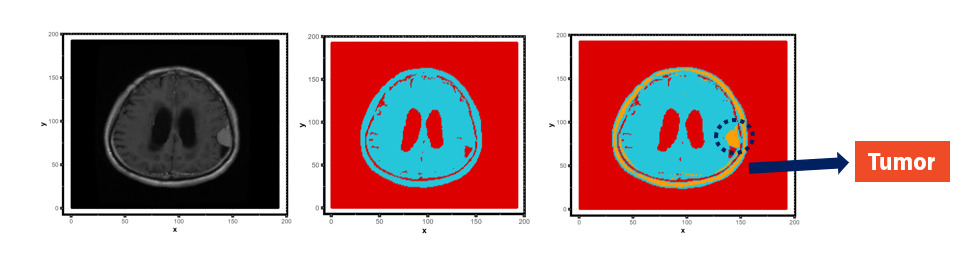
Ref: https://www.kaggle.com/datasets/masoudnickparvar/brain-tumor-mri-dataset
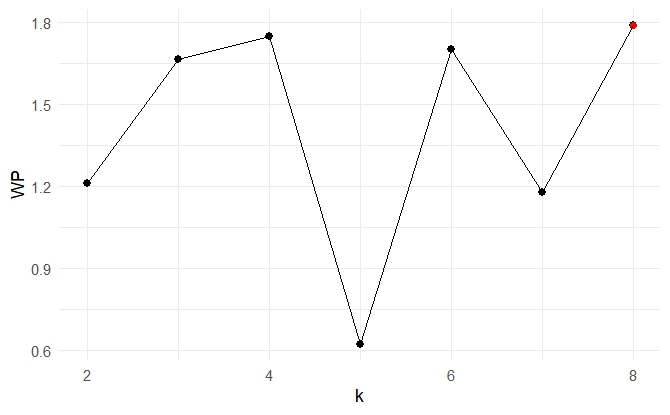
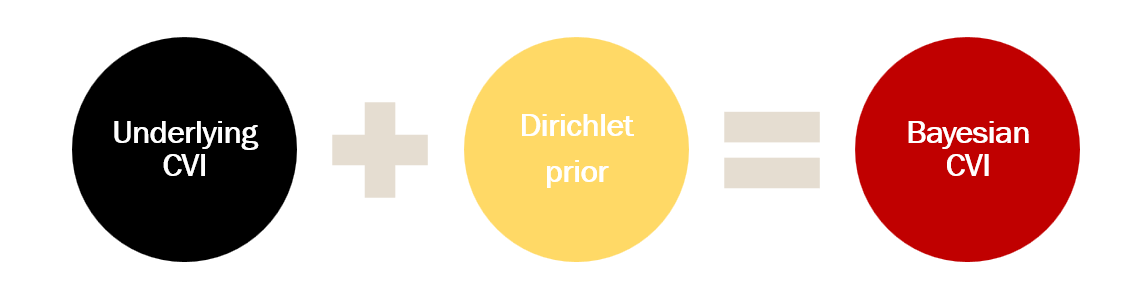
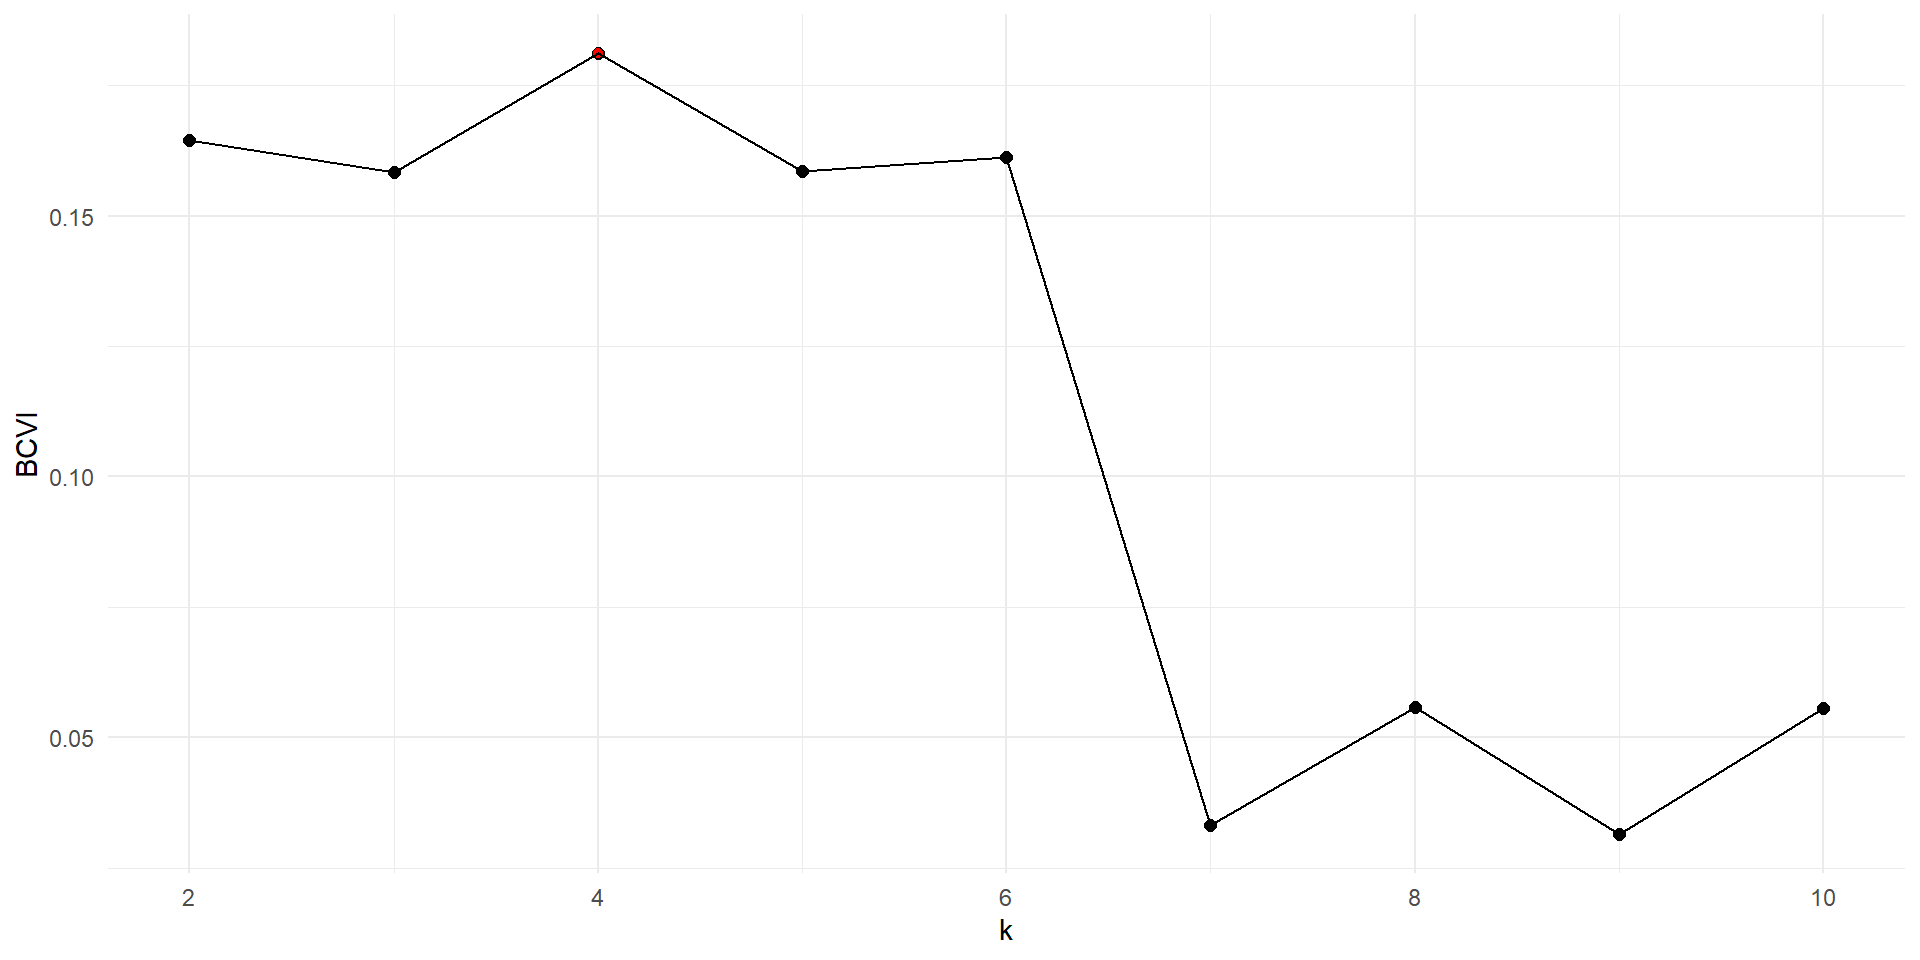
Bayesian framework and cluster validity index
Idea
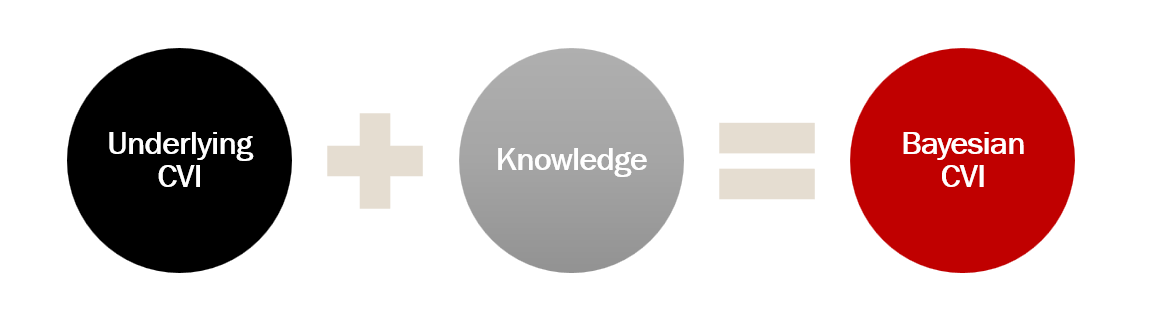
Bayesian framework and cluster validity index
To be more precise…
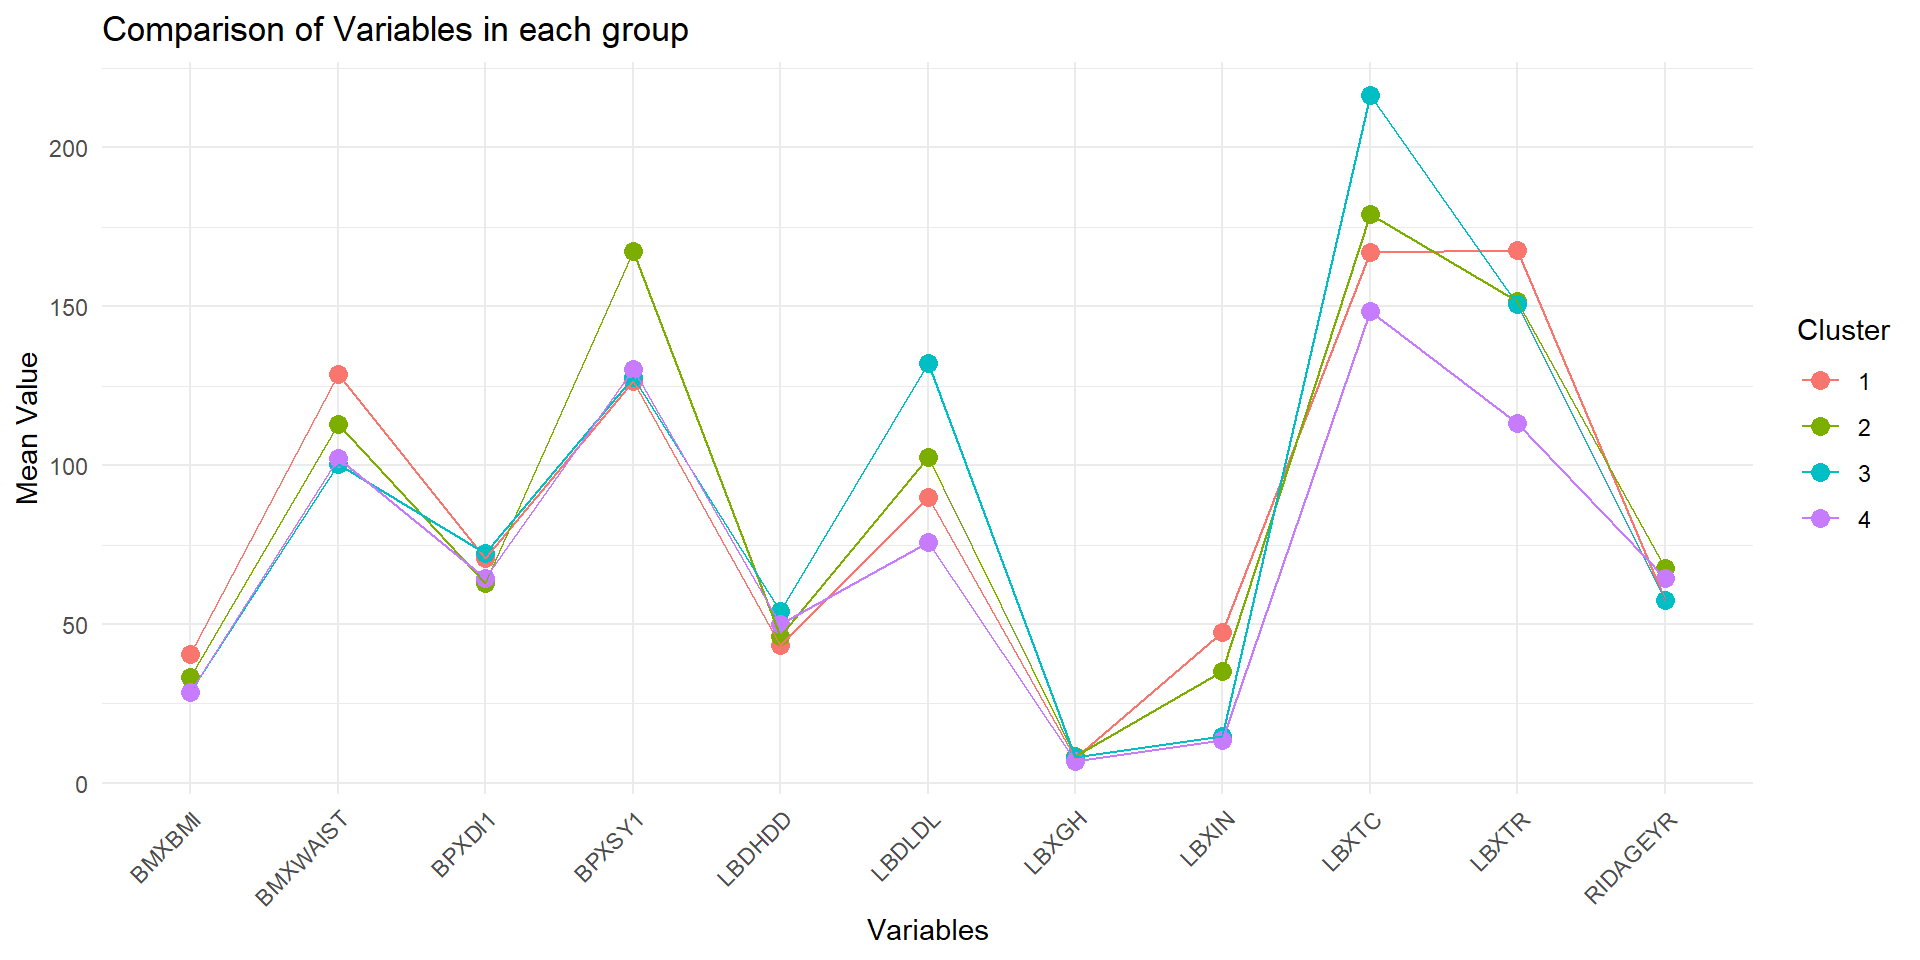
Visualize the result
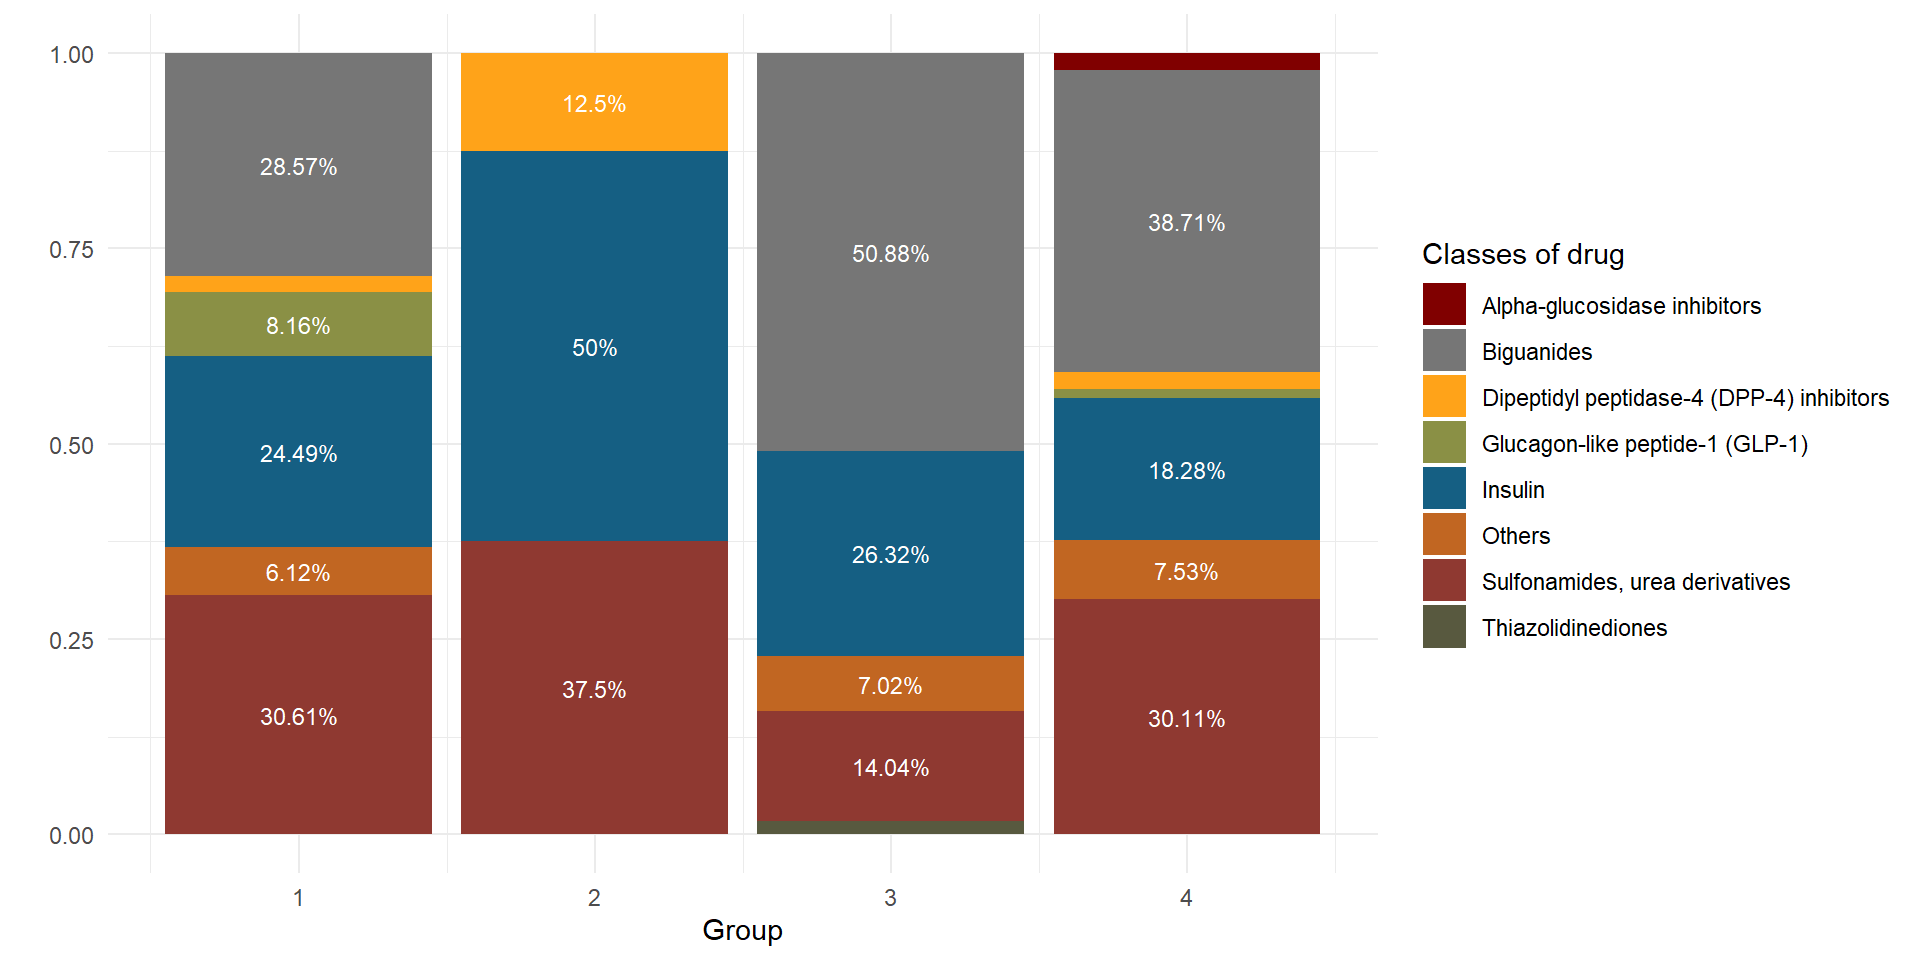
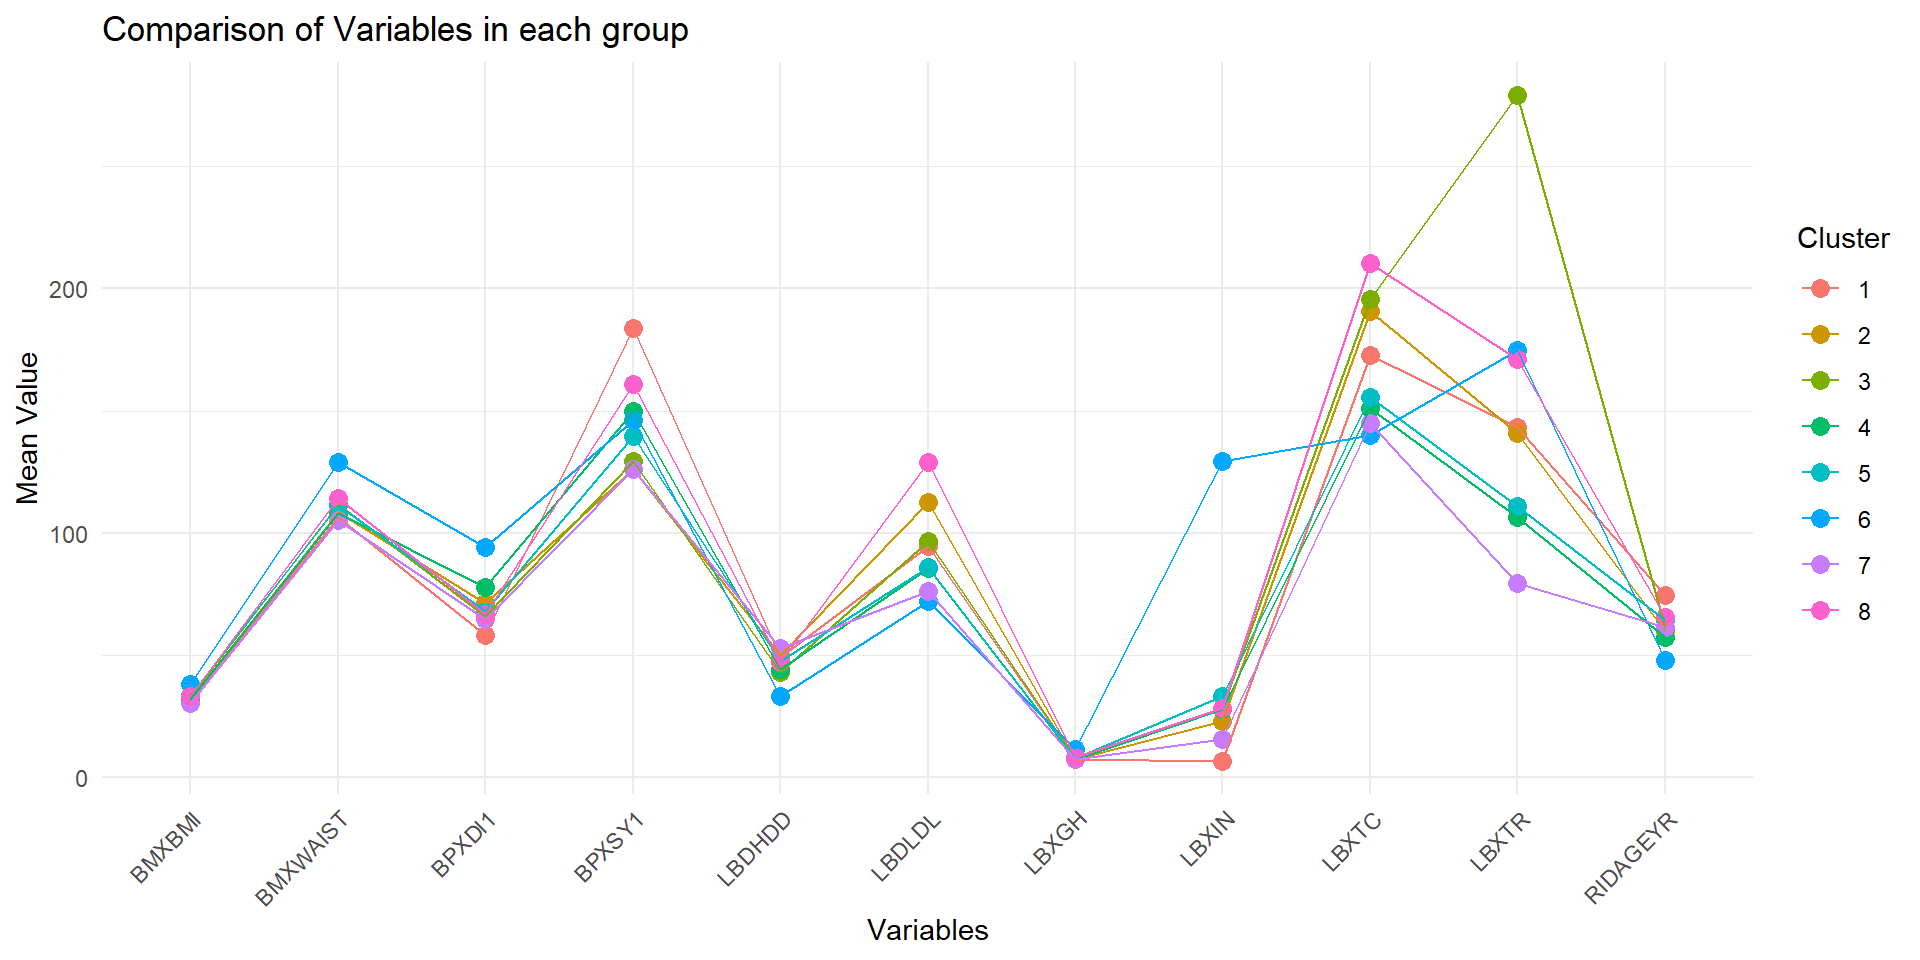
Characteristic comparison
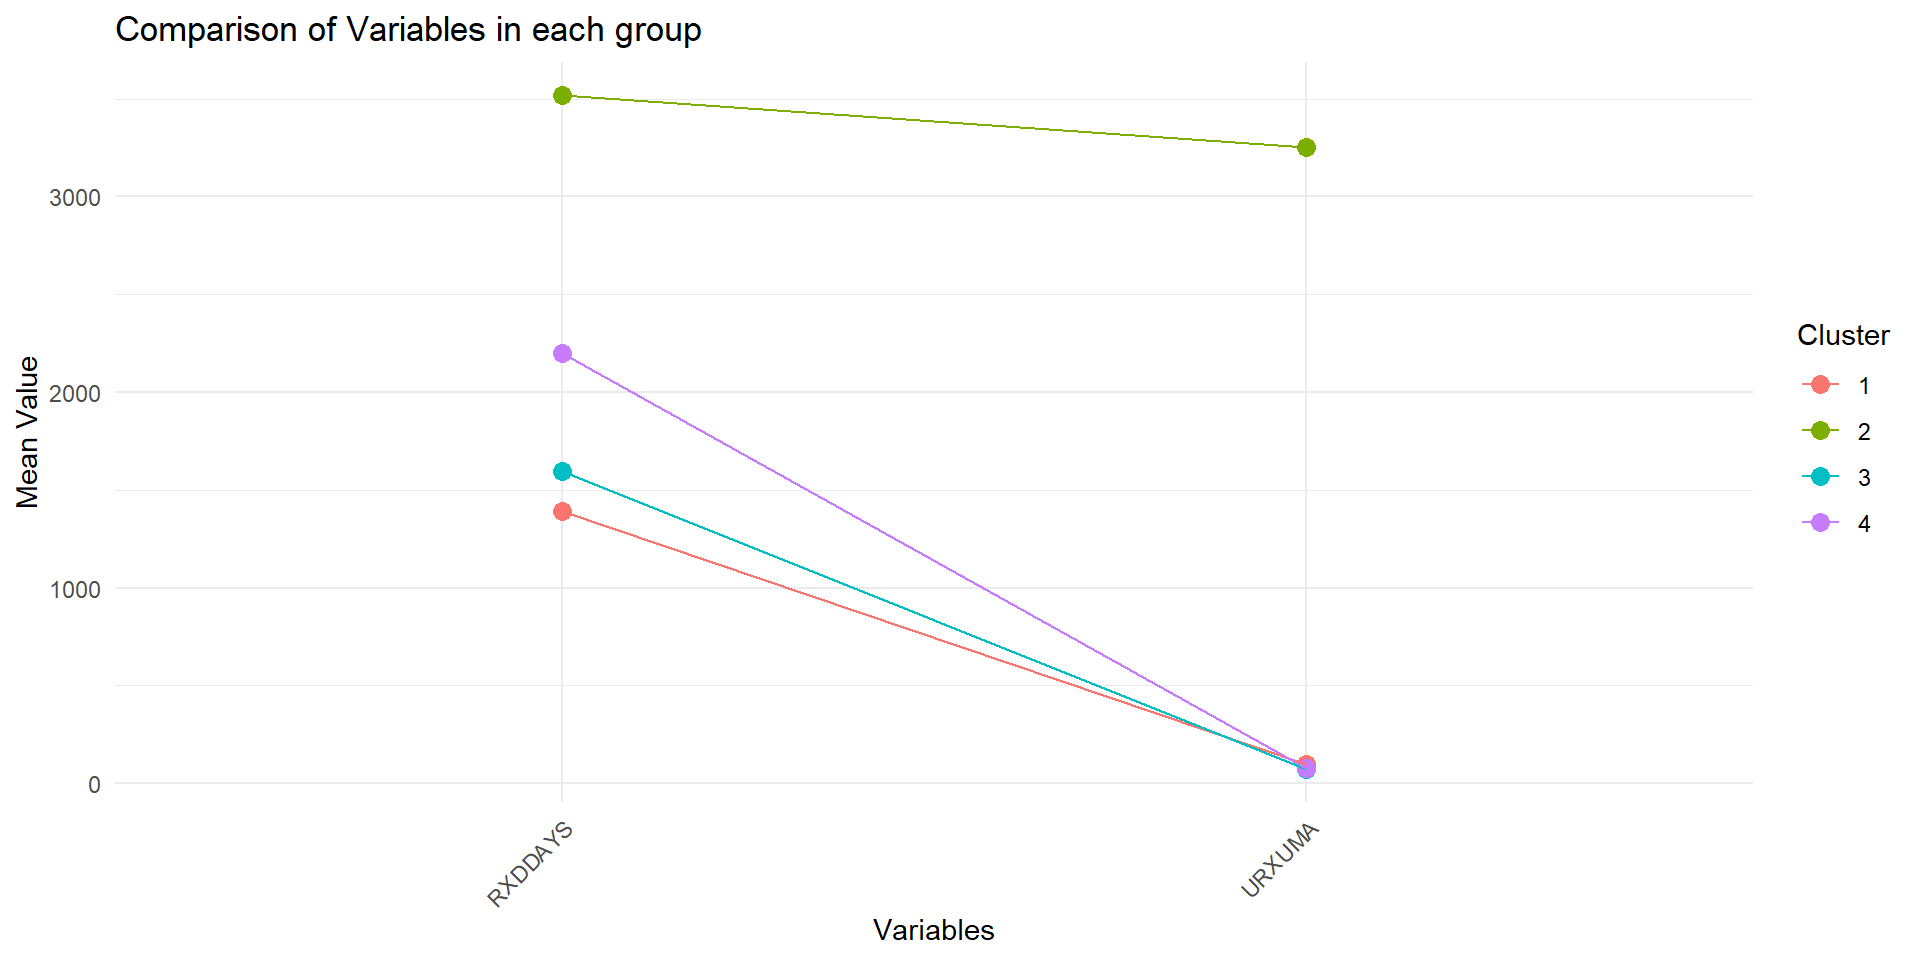
Distribution of drugs used in each group